
When it comes to analyzing contact center effectiveness, managers struggle to choose the most relevant metrics. Here, we review KPIs that measure customer experience and boost contact center performance.
Contact center experiences can influence brand loyalty and customer buying decisions. To ensure that customers receive a high-quality experience, managers should select a set of key performance indicators, or KPIs, they can use to measure agent performance. See top KPIs that you can leverage for your contact center.
First-Call Resolution
First-call resolution, or simply FCR, is a metric that describes an ability to resolve customer issues on the first attempt, with no follow-ups required. With FCR, you can detect issues with your first-line support procedures.
Higher FCR rates lead to improved customer loyalty. According to one study, 80% of customers who switched to a competitor said they would have stayed if their issue was resolved on their first contact.
This metric is calculated by dividing the number of resolved calls during the first contact by the number of total calls.
FCR = (Number of Сalls Resolved On the First Attempt) / (Number of First Calls)*100%
There are several ways to gather data for FCR such as:
- Ask customers if their issue was resolved at the end of conversations
- Keep track of no-repeat calls within a time frame
- Conduct post-call surveys
Customer Retention Rate
It’s easier and less expensive to retain customers than to attract new leads. Customer retention helps not only build long-lasting business relationships but also boost revenue.
Customer Retention Rate (CRR) measures the percentage of customers that maintain their relationships with a company during a certain period of time. CRR is a way to measure the customers that trust your brand.
CRR = ((EC-NC)/SC)*100%
- EC – number of customers at the end of the period
- NC – number of new customers during the period
- SC – number of customers at the start of the period
Let’s say you have 10,000 customers at the start of the two-month measuring period. During these two months, you attract 500 new customers. At the end of the period, you have 9,000 customers left.
With these inputs, we derive the expression: ((9,000-500)/10,000*100%; CRR = 85%.
Cost Per Contact
Cost per Contact (CPC) is one of the key metrics to measure your contact center and communication channel efficiency. With CPC, you can find out the cost to service one contact in each channel. The lower the contact cost, the more efficient the communication channel is.
To calculate CPC, you have to divide the total annual operating expenses of the contact center by the volume of inbound contacts.
CPC = Total Annual Operating Expenses/Volume of Inbound Contacts
Generally, the operating expense includes:
- Agent salaries and incentive compensations
- Сontractor premises, telecommunications, desktops, software licensing and training costs
Call Abandonment Rate
Call abandonment rate is the percentage of inbound calls that are abandoned before connecting to an agent. The metric shows how effectively your agents are managing the call load.
To get the abandonment rate, divide the number of abandoned calls by the total number of calls.
Call Abandonment Rate = (Abandoned Calls)/(Total Inbound Calls)*100%
Average Answer Time
The average answer time metric describes how fast your agents react inbound inquiries. The metric tracks the time elapsed between call arrival and agent response.
The formula looks as follows:
Average Answer Time = Total Wait Time for Answered Calls/Total Number of Answered Calls
Average Handle Time
Average handle time (AHT) represents the entire time your agents spend handling inquiries: from the moment the conversation starts until the customer's issue is resolved. You can use AHT to compare support time in different channels such as chats and phone calls.
To calculate AHT, divide the total time spent on processing requests by the number of contacts.
AHT = (Talk + Hold + Follow up)/Number of Contacts
- Talk – the total sum of agents’ time working with customers
- Hold – the total hold time during contacts
- Follow-up – the total work time after contacts
Service Level
The service level metric indicates whether the company is actually fulfilling its promised responsibilities to customers. In contact centers, service level is defined as the percentage of calls answered within a predefined period of time.
For instance, you can set a 30-second wait time in the queue. If your agents answered 80% of calls within 30 sec, then your service level is 80%.
Managers set service level objectives to motivate the team’s performance and demonstrate its commitment to customers.
Average Call Transfer Rate
Average call transfer rate measures how often your agents transfer calls to other agents or departments. With this metric, you can identify if your routing logic or smart IVR is properly configured. Low rates may also indicate that agents need additional training.
To calculate the average call transfer rate, divide the total number of transferred calls by the number of processed calls during a certain period of time.
Average Call Transfer Rate = Total Number of Transferred Calls/Number of Processed Calls
The lower the rate, the better the customer experience. If callers constantly wait in the queue to connect to another department, they're more likely to be frustrated with the experience.
Customer Satisfaction Score
Customer satisfaction score, or CSAT, is a metric that helps you better understand how customers feel about your service or agent’s performance. It’s one of the most straightforward and popular ways to measure customer satisfaction.
To gather data for CSAT, your agents or bots can end conversations with the question like in the scheme below.
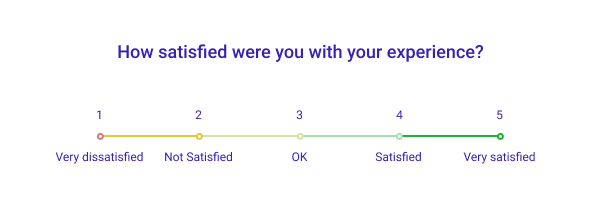
The final score is the ratio of ‘very satisfied’ and ‘satisfied’ to the total number of survey respondents.
CSAT = (Very Satisfied + Satisfied)/(Total Number of Respondents) * 100%
Occupancy Rate
Occupancy rate shows the extent to which agents are engaged in working with customers. This metric allows you to identify agent performance issues.
Occupancy Rate = (Total Contact Handling Time/Total Logged Time) * 100%
Low occupancy rate could be due to:
- Duties not call-related
- Longer breaks
- Frequency of meetings/events/training sessions
- Poor agent work habits
Trust Calculations to Voximplant Kit
Voximplant Kit is an omnichannel contact center, making it easy to add remote agents, communication channels and AI-based bots.
With Voximplant Kit, you can track the performance of your contact center. Monitor your activities in real time or check the historical data through a live dashboard. Here’s what you can analyze:
- Missed and handled calls
- Average answer time
- Number of calls in queues
- Average queue time
- Occupancy rate
- Service level
- Average after service time
- Average handle time
Deploy a cloud contact center in minutes. No coding is required.
![]()