Reviewing PDS campaign reports
PDS campaign historical reports display performance indicators for each agent campaign over the selected period.
Data in the reports is updated within an hour.
- On the left sidebar, select Reporting > Reports.
- Select PDS campaigns.
- Set the report date range and specify the interval: per Hour, Day, Week, Month, or All time.
- Review the report.
A PDS campaign report includes the following metrics:
Service level (%) – The ratio of calls answered within the first 20 seconds to the total number of calls received.
Total calls – The total number of handled and missed calls. Missed calls include abandoned and lost calls. A call is abandoned when a customer answers the phone and hangs up before an agent answers. A call is considered lost when a customer is removed from the queue by the system without being assigned to an agent.
Handled calls – The total number of calls handled in the campaign within the specified period.
Lost calls – The number of lost calls in the campaign within the specified period. A call is considered lost when a customer is removed from a queue without being assigned to an agent.
Abandoned calls – The number of abandoned calls in the campaign within the specified period. A call is considered abandoned when a customer answers the phone and hangs up before an agent answers.
Avg. time in queue – Average time a customer spends in a queue. The calculation includes both handled and missed calls.
Min. time in queue – Minimum queueing time.
Max. time in queue – The longest queueing time.
Avg. response time – Average time a customer spends queueing until an agent answers the call. The calculation includes only handled calls.
Avg. handle time – Average time an agent spends handling calls (In service + After service).
Avg. after service time – Average time an agent spends on post-call activities (After service).
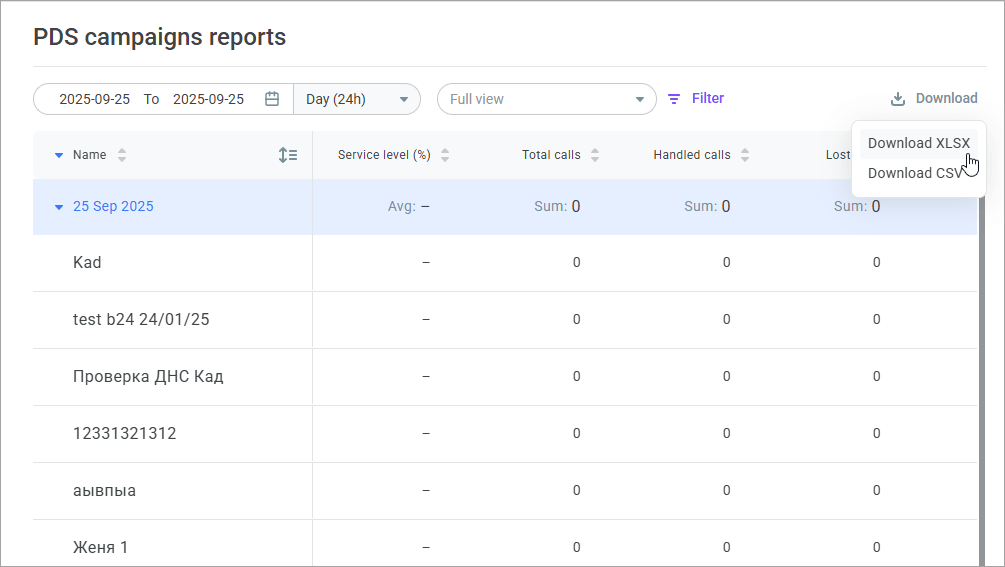
- Click the Download button to download the report as an .xls or .csv file.

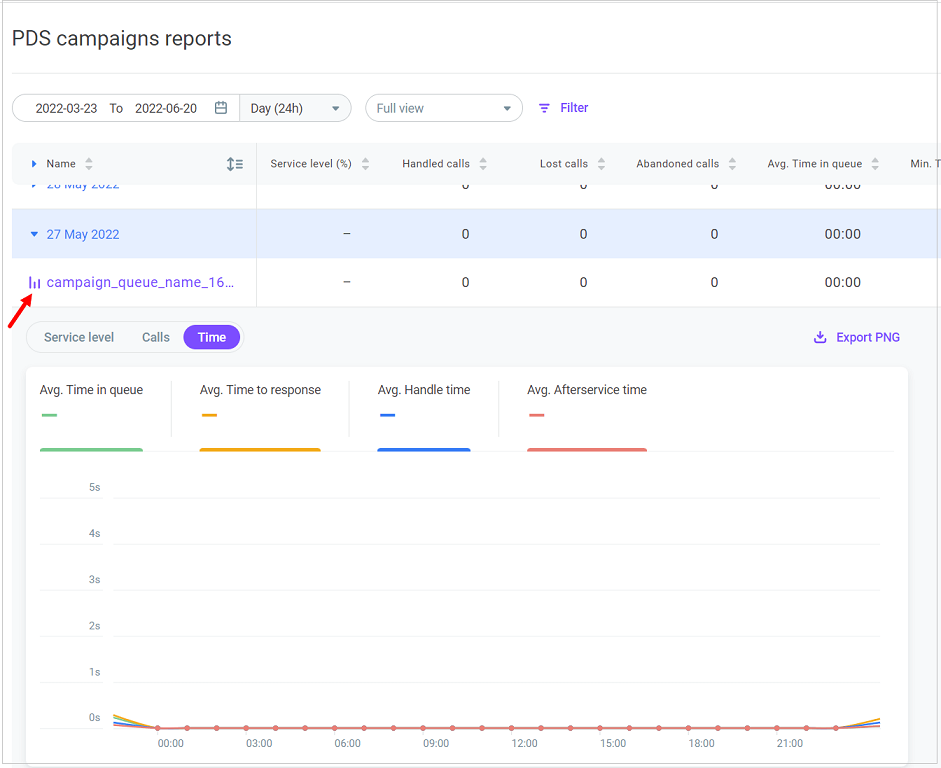
- You can also view report data in chart form. For that, click the chart icon in front of the campaign name and select one of the tabs: Service level, Calls, Time. The charts give you more visibility. It helps evaluate the efficiency of your PDS campaign.

- Click Export PNG to download the chart in .png format.
You can apply filters to control which data to include in the report by clicking Settings. You can save your filters as View, give your view a name, and share it with other users.
