Reviewing contact center overall statistics
The contact center overall statistics include the total number of inbound calls and chats processed in your CC within the selected period and information on workload distribution.
- Log in to your Voximplant Kit account.
- On the left sidebar, select Reporting > Reports.
- Select the Overview subsection to review various contact center statistics on dashboards.
You can apply filters to retrieve data for a specific period and/or queue.
Calls and messaging
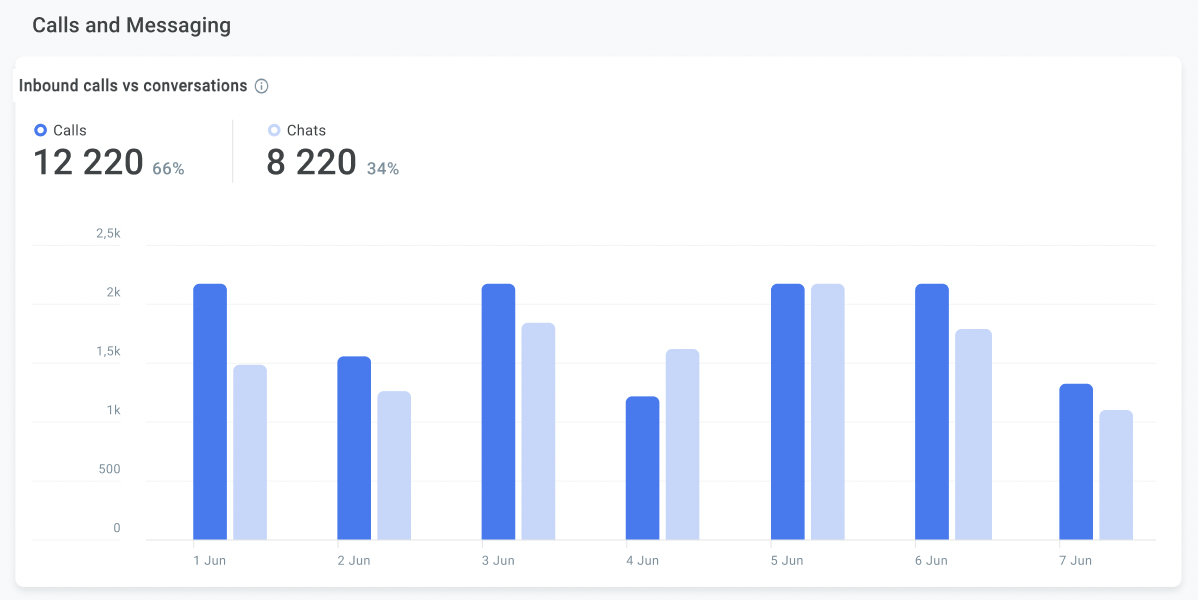
In the Inbound calls vs conversations section, review the percentage ratio of calls and chats processed in queues within the selected period.

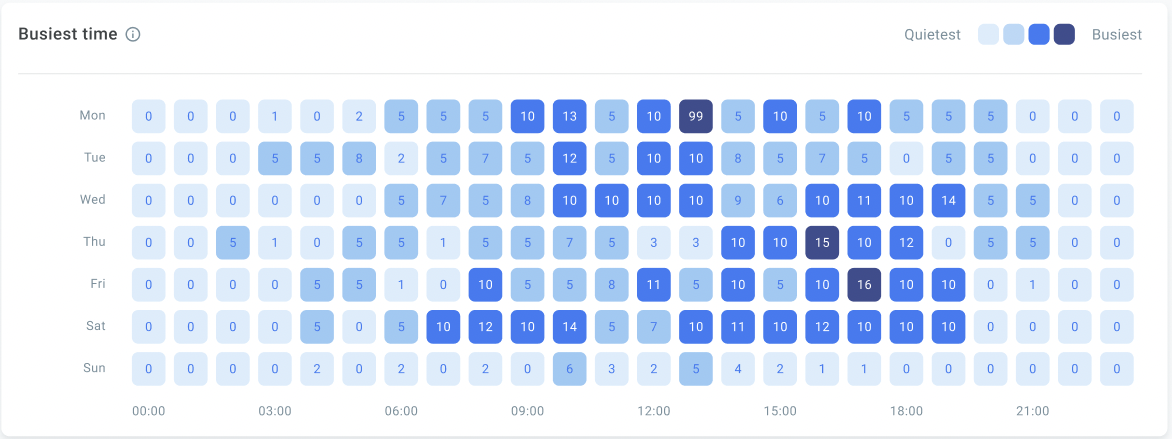
In the Busiest time section, review and analyze periods of high and low call and conversation volumes.

Each cell displays an average number of conversations processed in queues for the selected period. If you set a weekly interval, a cell represents the number of calls and chats for a specific hour of the day. If the interval is more than a week, each cell displays an average number of all calls and chats for a certain hour of a particular day, repeating during this period.
Calls
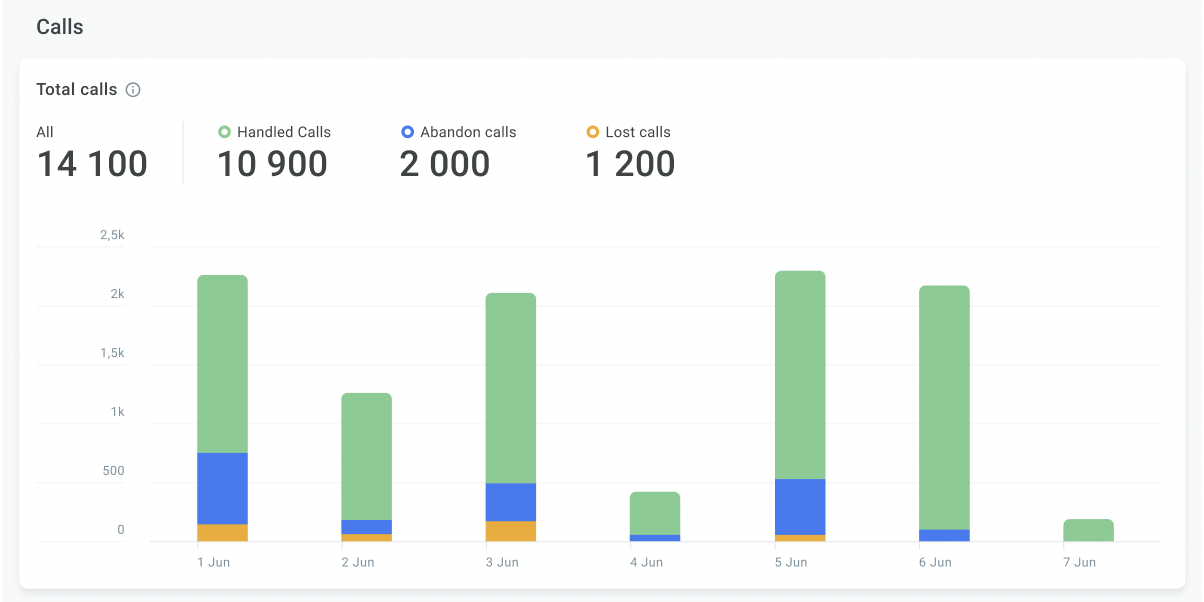
In the Total calls section, review the total number of calls received from queues within the selected period, including handled, lost, and abandoned calls.

Messaging
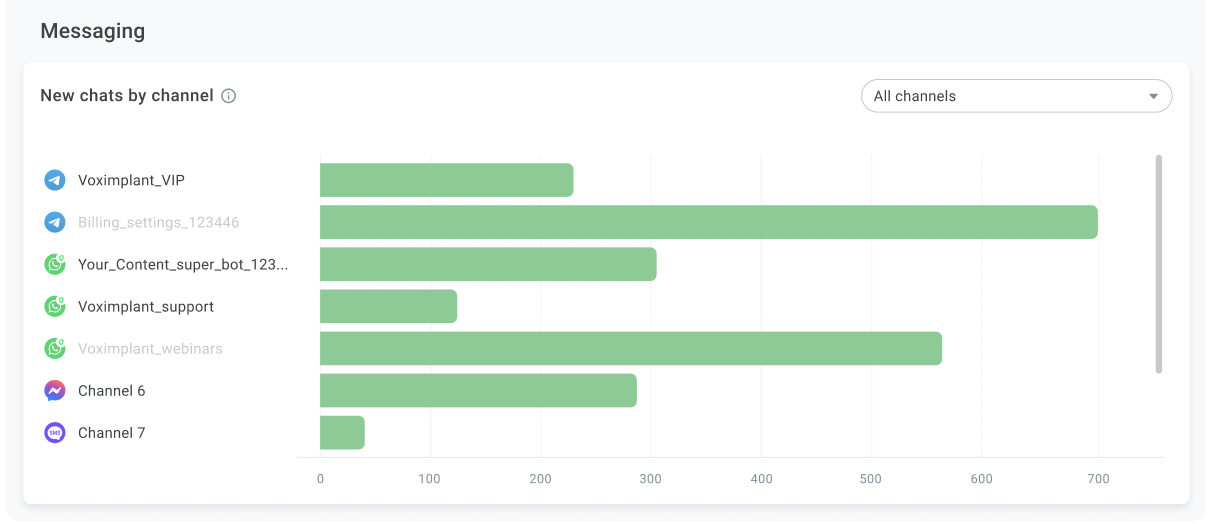
In the New chat by channel section, review the number of inbound conversations for all or particular channels. The metric only includes conversations that came from queues.

