Exploring reports
Reporting shines a light on what is happening across your contact center: how long customers spend in a queue waiting for agents, how many calls agents manage or fail to handle, how the load is distributed between agents, etc. Tracking metrics is crucial for optimizing contact center performance and enhancing customer experience.
In the Reports section, track statistics on all calls and chats processing in the contact center and review reports of agents, queues, channels, and PDS campaigns.
Contents
Reviewing contact center general statistics
- Log in to your Voximplant Kit account.
- On the left sidebar, select Reporting > Reports.
- Select the Overview subsection to review various contact center statistics on dashboards.
You can apply filters to retrieve data for a specific period and/or queue.
Calls and messaging
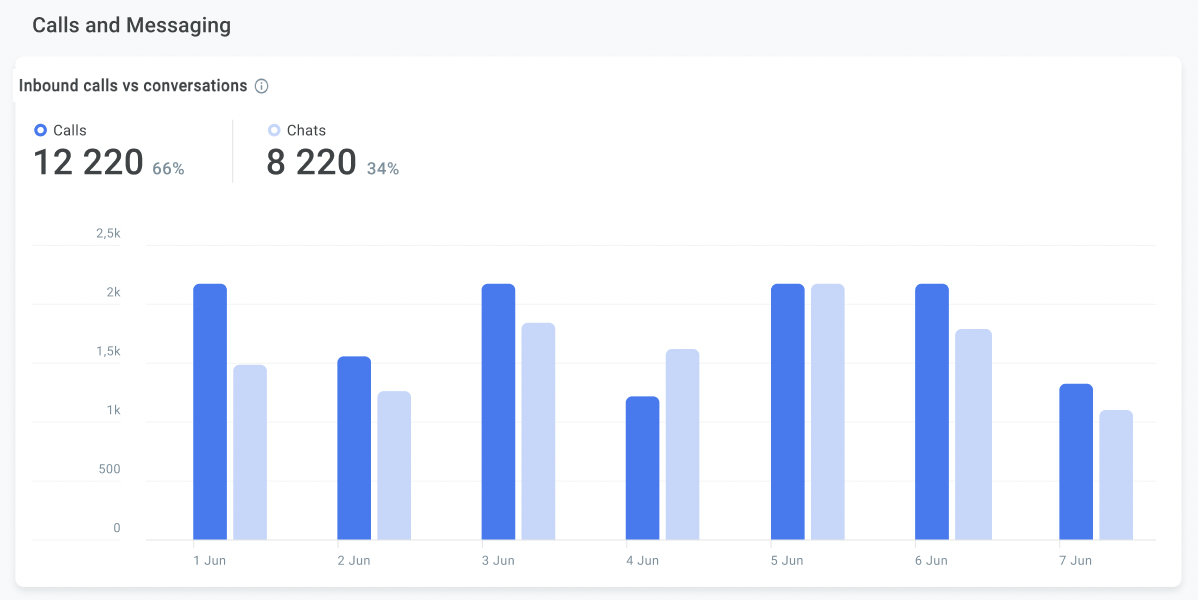
In the Inbound calls vs conversations section, review the percentage ratio of calls and chats processed in queues within the selected period.
In the Busiest time section, review and analyze periods of high and low call and conversation volumes.
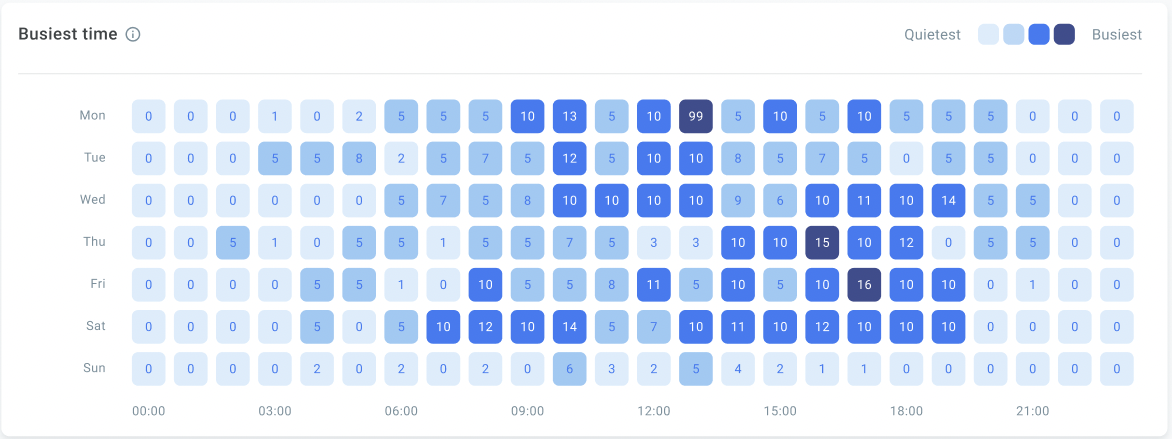
Each cell displays an average number of conversations processed in queues for the selected period. If you set a weekly interval, a cell represents the number of calls and chats for a specific hour of the day. If the interval is more than a week, each cell displays an average number of all calls and chats for a certain hour of a particular day, repeating during this period.
Calls
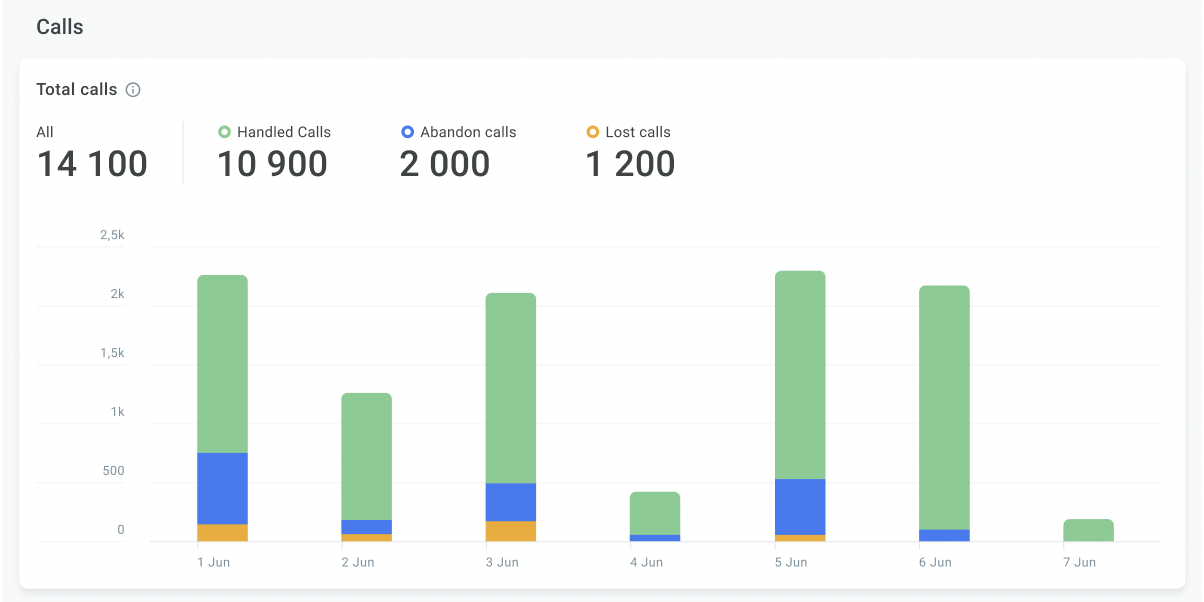
In the Total calls section, review the total number of calls received from queues within the selected period, including handled, lost, and abandoned calls.
Messaging
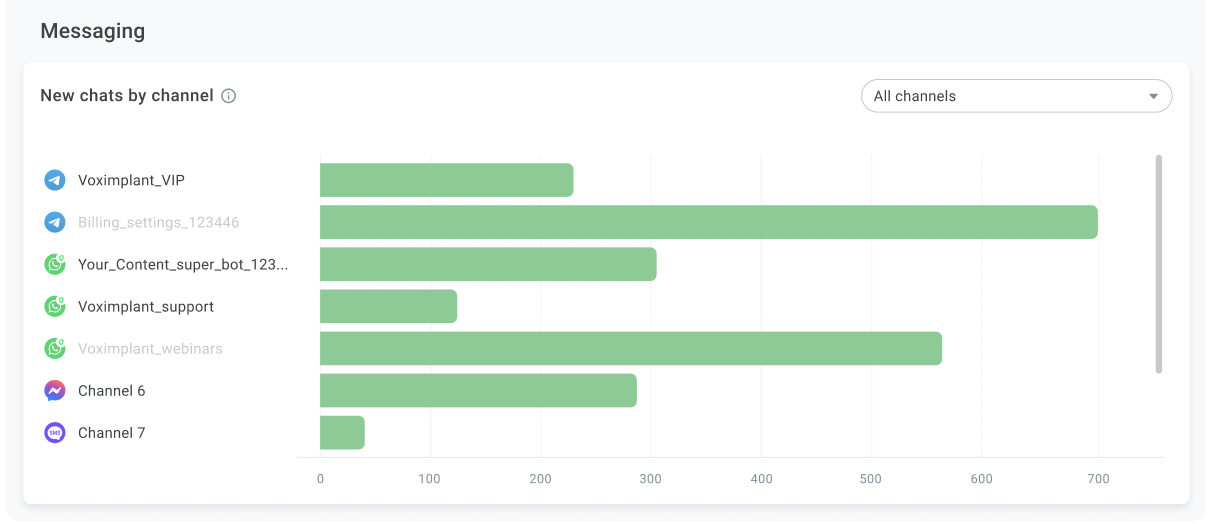
In the New chat by channel section, review the number of inbound conversations for all or particular channels. The metric only includes conversations that came from queues.
Reviewing agent reports
Data in the reports is updated within an hour.
- On the left sidebar, select Reporting > Reports.
- Select Agents.
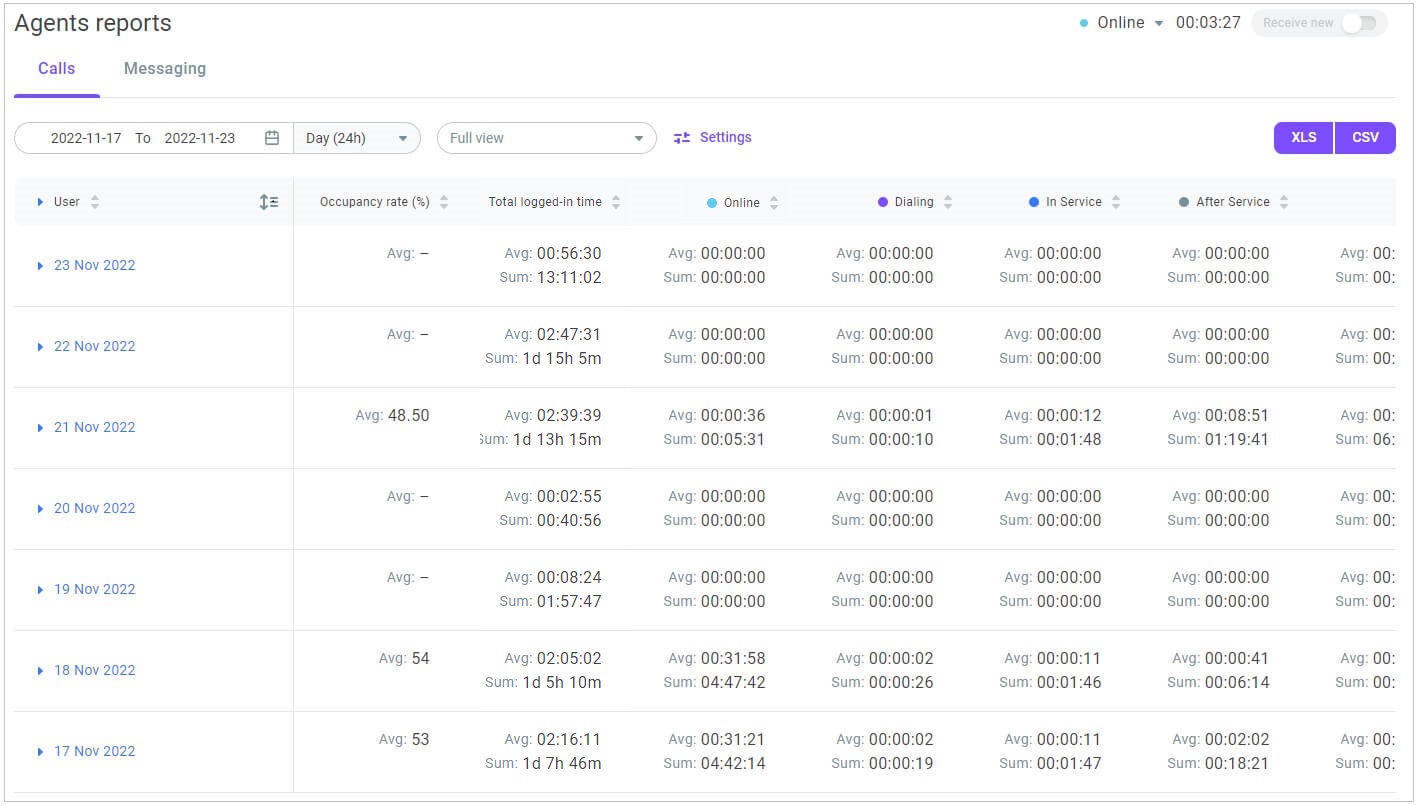
- On the Calls tab, set the report date range.
- Specify the data display interval: per Hour, Day, Week, Month, or All time.
- Review the report.
An agent call report includes the following metrics:
Occupancy rate (%) – The time the agent spent working on customer requests to the total time on the line (In service + After service / Ready + Dialing + In service + After service).
Outbound calls – The number of outbound calls performed by the agent via the softphone.
Outbound conversations – The number of actual outbound conversations that lasted more than 5 sec.
Total logged-in time – The agent's total login time. This value includes time in all statuses, except Offline.
Statuses – The agent's system (Online, Ready, Dialing, In service, After service, DND, Banned) and custom statuses. For details on agent statuses, go here.
Handled calls – The total number of calls handled by the agent. The metric only includes calls processed in queues.
Avg. handle time – The average time the agent spends to process inbound calls from queues. The metric is calculated as the amount of time spent in the In service + After service statuses.
Closure success – The number of calls the agent labeled with the Closure success wrap-up code (the calls ended successfully). The metric only includes calls processed in campaigns.
% of closed successfully – The calls the agent closed successfully to the total number of processed calls. The metric only includes calls processed in campaigns.
Closure neutral – The number of calls the agent labeled with the Closure neutral wrap-up code (the calls ended with neutral or no output). The metric only includes calls processed in campaigns.
% of closed neutrally – The calls the agent closed neutrally to the total number of processed calls. The metric only includes calls processed in campaigns.
Closure negative – The number of calls the agent labeled with the Closure negative wrap-up code (the calls ended with negative output). The metric only includes calls processed in campaigns.
% of closed negatively – The calls the agent closed negatively to the total number of processed calls. The metric only includes calls processed in campaigns.
Callback – The number of calls the agent labeled with the Callback wrap-up code (a callback is scheduled to a customer at the specified time). The metric only includes calls processed in campaigns.
% of callback – The calls the agent closed and scheduled a callback to the total number of processed calls. The metric only includes calls processed in campaigns.
Add to DNC list – The number of calls the agent labeled with the Add to DNC list wrap-up code (a customer must be added to the DNC list attached to the campaign). The metric only includes calls processed in campaigns.
% of added to DNC list – The calls after which the agent added a customer to a DNC list to the total number of processed calls. The metric only includes calls processed in campaigns.
Min. reaction time – The minimum time from the moment a call is assigned to the agent until they answer the phone. The metric only includes handled calls that came from queues.
Max. reaction time – The longest time from the moment a call is assigned to the agent until they answer the phone. The metric only includes handled calls that came from queues.
Avg. reaction time – The average time from the moment a call is assigned to the agent until they answer the phone. The metric only includes handled calls that came from queues.
Min. after service time – The minimum time the agent spends on post-call activities (after service). The metric only includes calls processed in queues.
Max. after service time – The longest time the agent spends on post-call activities (after service). The metric only includes calls processed in queues.
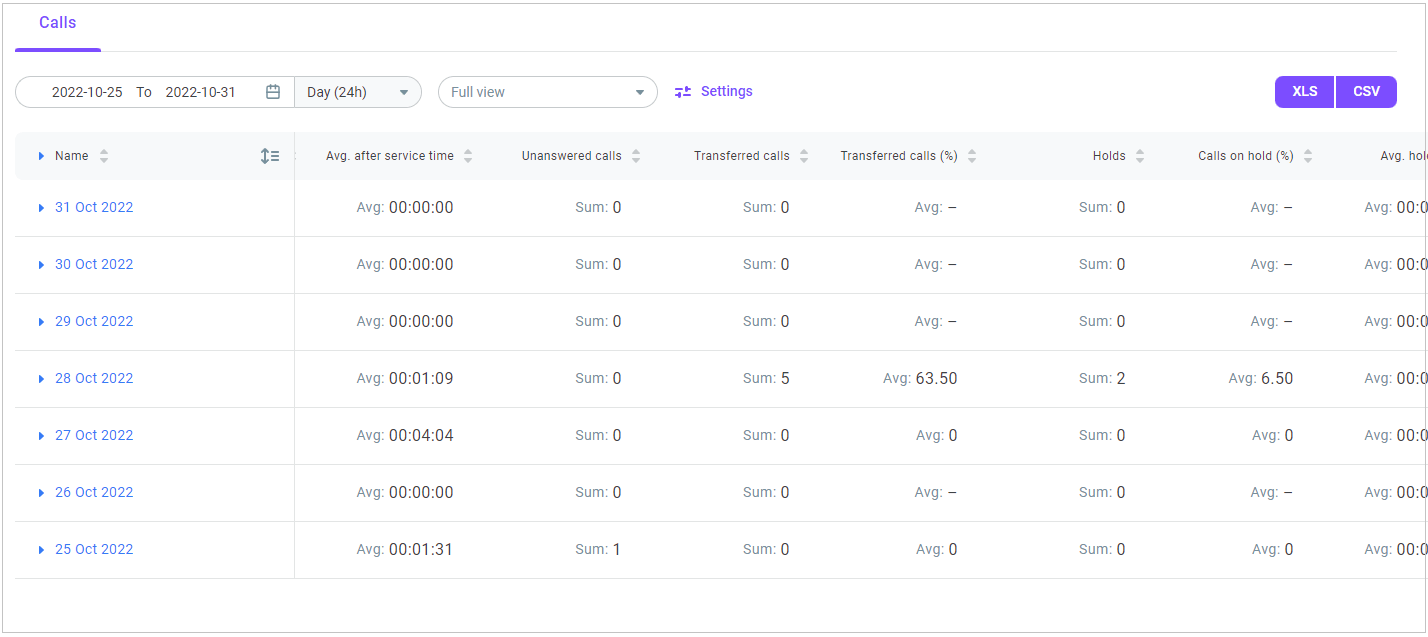
Avg. after service time – The average time the agent spends on post-call activities (after service). The metric only includes calls processed in queues.
Unanswered calls – The number of calls assigned to but not answered by the agent. The metric only includes calls received from queues.
Utilization (%) – The ratio of the productive time to the agent's total payable time within the specified period. The payable time includes all agent’s unavailability statuses, like Online, DND, Banned, and custom statuses, excluding Offline. This value is calculated as follows: (Ready + Dialing + In service + After service) / (all unavailability statuses - Offline).
Transferred calls (%) – The calls transferred to another agent/queue to the total number of handled calls. The metric only includes calls processed in queues.
Holds – The total number of holds used by an agent while handling calls. The metric only includes calls processed in queues.
Calls on hold (%) – The ratio of calls put on hold at least once to the total number of handled calls. The metric only includes calls processed in queues.
Min. hold time – The minimum time a customer spends on hold before speaking to the agent. The metric only includes calls processed in queues.
Max. hold time – The longest time a customer spends on hold before speaking to the agent. The metric only includes calls processed in queues.
Avg. hold time – The ratio of the total hold time to the total number of calls handled by the agent. The metric only includes calls processed in queues.
- Click XLS or CSV to download the report as an .xls or .csv file.
- Select the Messaging tab.
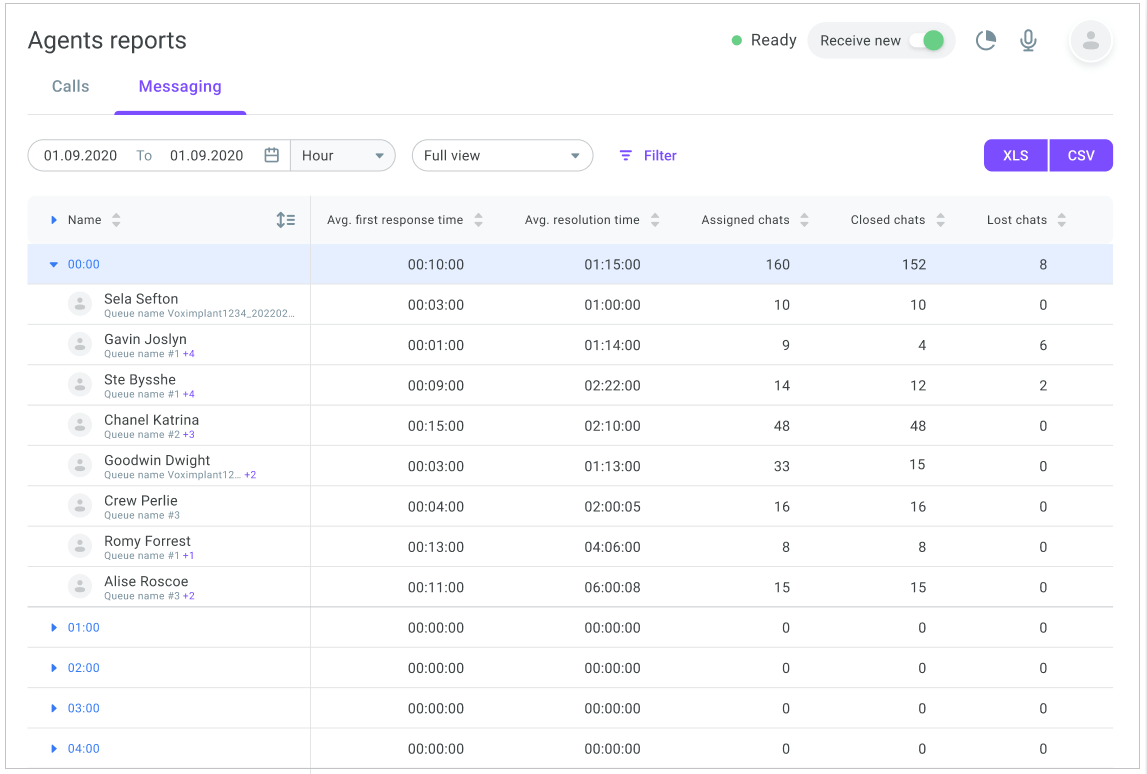
- Specify the period and interval for the report.
- Review the report.
An agent messaging report includes the following metrics:
Avg. resolution time – The average time it takes the agent to resolve a customer issue. The metric only includes conversations processed in queues.
Assigned chats – The number of conversations assigned to the agent within the selected period. The metric only includes conversations that came from queues.
Closed chats – The total number of conversations closed by the agent within the selected period. The metric only includes conversations processed in queues.
Lost chats – The total number of conversations lost by the agent within the selected period. The metric only includes conversations that came from queues.
- Click XLS or CSV to download the report as an .xls or .csv file.
Reviewing group reports
Data in the reports is updated within an hour.
- On the left sidebar, select Reporting > Reports.
- Select Groups.
- On the Calls tab, set the report date range.
- Specify the data display interval: per Hour, Day, Week, Month, or All time.
- Review the report.
A group call report includes the following metrics:
Handled calls – The total number of calls from queues handled by the group.
Outbound calls – The number of outbound calls performed by the group via the softphone.
Outbound conversations – The number of actual outbound conversations that lasted more than 5 sec.
Avg. reaction time – The total time it takes the group agents to answer a call (from the moment a call is assigned until it is answered) to the total number of calls handled by the group. This value includes only handled calls that came from queues.
Avg. handle time – The average time it takes the group agents to handle inbound calls (In service + After service). The metric only includes calls processed in queues.
Avg. talk time – The average time the group agents spend talking to customers, excluding holds and after service work. This value is calculated as In service minus Hold. The metric only includes calls processed in queues.
Avg. after service time – The average time the group agents spend on post-call activities. The metric only includes calls processed in queues.
Unanswered calls – The total number of calls assigned but not answered by the group agents. The metric only includes calls that came from queues.
Transferred calls – The total number of calls transferred by the group agents to other queues/agents. The metric only includes calls that came from queues.
Transferred calls (%) – The ratio of transferred calls to the total number of handled calls. The metric only includes calls that came from queues.
Holds – The total number of holds used by the group agents while handling calls. The metric only includes calls that came from queues.
Calls on hold – The ratio of calls put on hold at least once to the total number of handled calls. The metric only includes calls that came from queues.
Avg. hold time – The ratio of the total hold time to the total number of calls handled by the group. The metric only includes calls that came from queues.
Occupancy rate (%) – The time the group agents spend working on customer requests to the total hours they spend on the line (In service + After service / full shift time).
- Click XLS or CSV to download the report as an .xls or .csv file.
Reviewing queue reports
Data in the reports is updated within an hour.
- On the left sidebar, select Reporting > Reports.
- Select Queues.
- On the Calls tab, set the report date range.
- Specify the data display interval: per Hour, Day, Week, Month, or All time.
- Review the report.
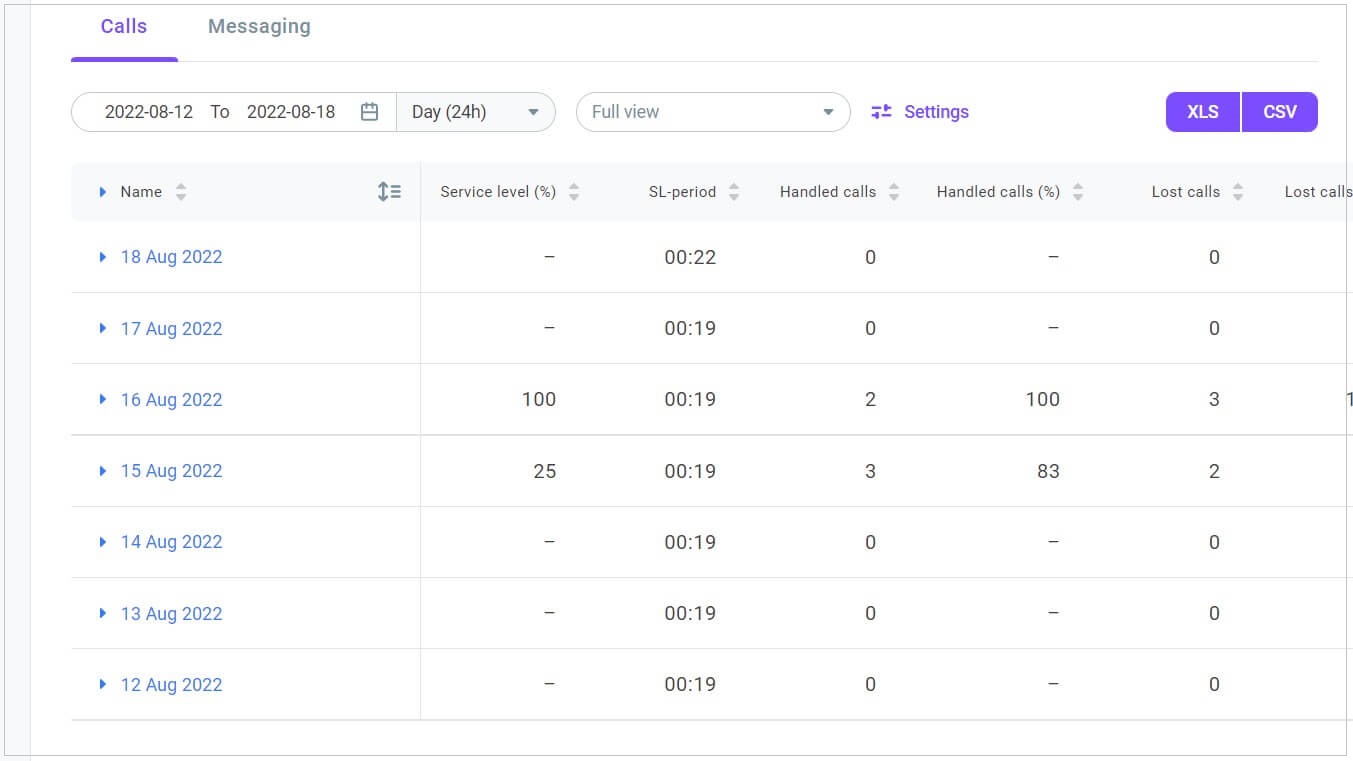
A queue call report includes the following information:
Service level (%) – The ratio of calls answered in the queue within the specified SL-period to the total number of calls.
SL-period – The threshold time a customer waits in the queue for an available agent required for the queue service level (SL) calculation. The default SL-period is 20 seconds.
When you edit the SL-period for a queue, its Service level ratio for the current hour is re-calculated according to the modified SL-period. The queue Service level ratios for the previous hours remain unchanged.
Handled calls – The number of calls handled in the queue within the specified period.
Handled calls (%) – The ratio of the calls handled in the queue to the total number of calls.
Lost calls – The number of lost calls in the queue within the specified period. A call is lost if a customer is removed from the queue by the system (the call goes to the Fail port of the Call-to-queue block). For example, when a customer waits in the queue for a while and is removed from the queue when the maximum waiting time elapses (set up in the queue settings). A call is also lost when there are no agents in the queue in operational statuses (all statuses, except Offline, DND, and custom) - in this case the customer is immediately removed from the queue.

Lost calls (%) – The ratio of lost calls in the queue to the total number of calls.
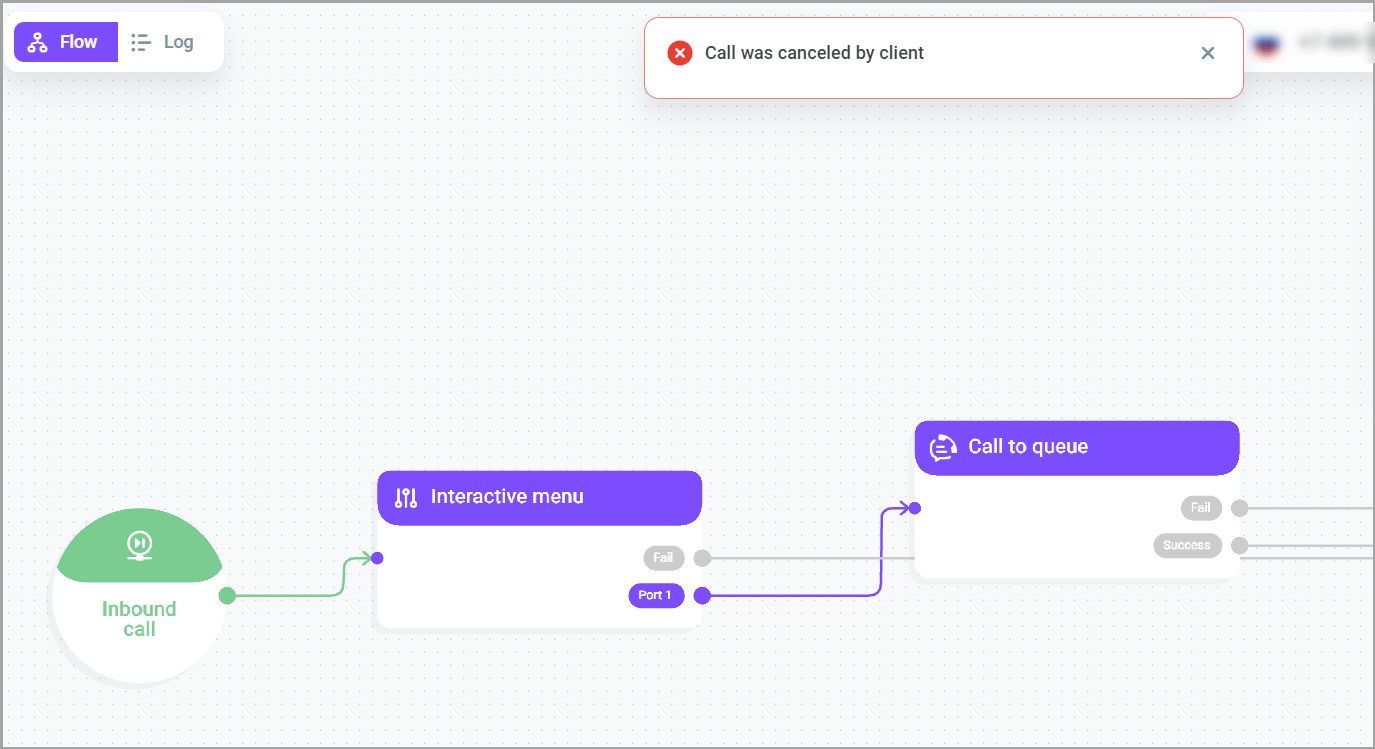
Abandoned calls – The number of abandoned calls in the queue within the specified period. A call is abandoned when a customer waits in the queue and then cancels the call before an agent answers the phone.
Avg. time in queue – The average time a customer spends in the queue. The calculation includes both handled and missed calls.
Min. time in queue – The minimum time a customer spends in the queue.
Max. time in queue – The longest time a customer spends in the queue.
Avg. response time – The average time a customer waits in the queue until an agent answers the call. The calculation includes only handled calls.
Avg. handle time – The average time it takes an agent to handle an inbound call in the queue (In service + After service).
Avg. after service time – The average time queue agents spend on post-call activities (after service).
Transferred calls (%) – The ratio of the calls transferred to another agent/queue to the total number of handled calls.
Holds – The total number of holds used in the calls handled in the queue.
Calls on hold (%) – The ratio of calls put on hold at least once to the total number of calls handled in the queue.
Avg. hold time – The ratio of the total hold time to the total number of calls handled in the queue.
- Click XLS or CSV to download the report as an .xls or .csv file.
- On the Messaging tab, specify the period and interval.
- Review the report.
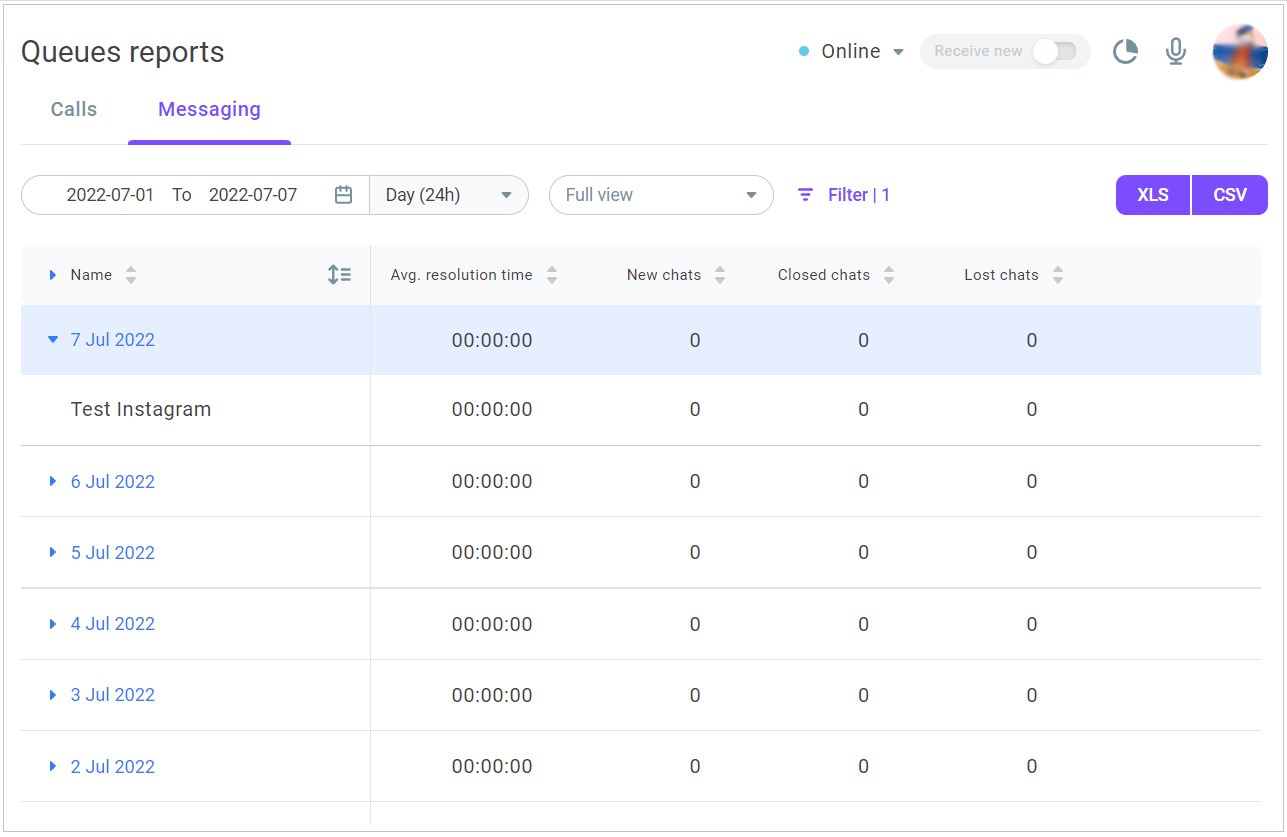
A queue messaging report includes the following metrics:
Avg. resolution time – The average time it takes an agent to resolve a customer conversation in the queue.
New chats – The number of new conversations in the queue.
Closed chats – The total number of conversations closed in the queue within the specified period.
Lost chats – The total number of conversations lost in the queue within the specified period (when a customer leaves the conversation without being assigned to an agent).
- Click XLS or CSV to download the report as an .xls or .csv file.
Reviewing channel reports
Data in the reports is updated within an hour.
- On the left sidebar, select Reporting > Reports.
- Select Channels.
The Channels section is not available to users with the Supervisor role.
- Set the report date range and specify the interval: per Hour, Day, Week, Month, or All time.
- Review the report.
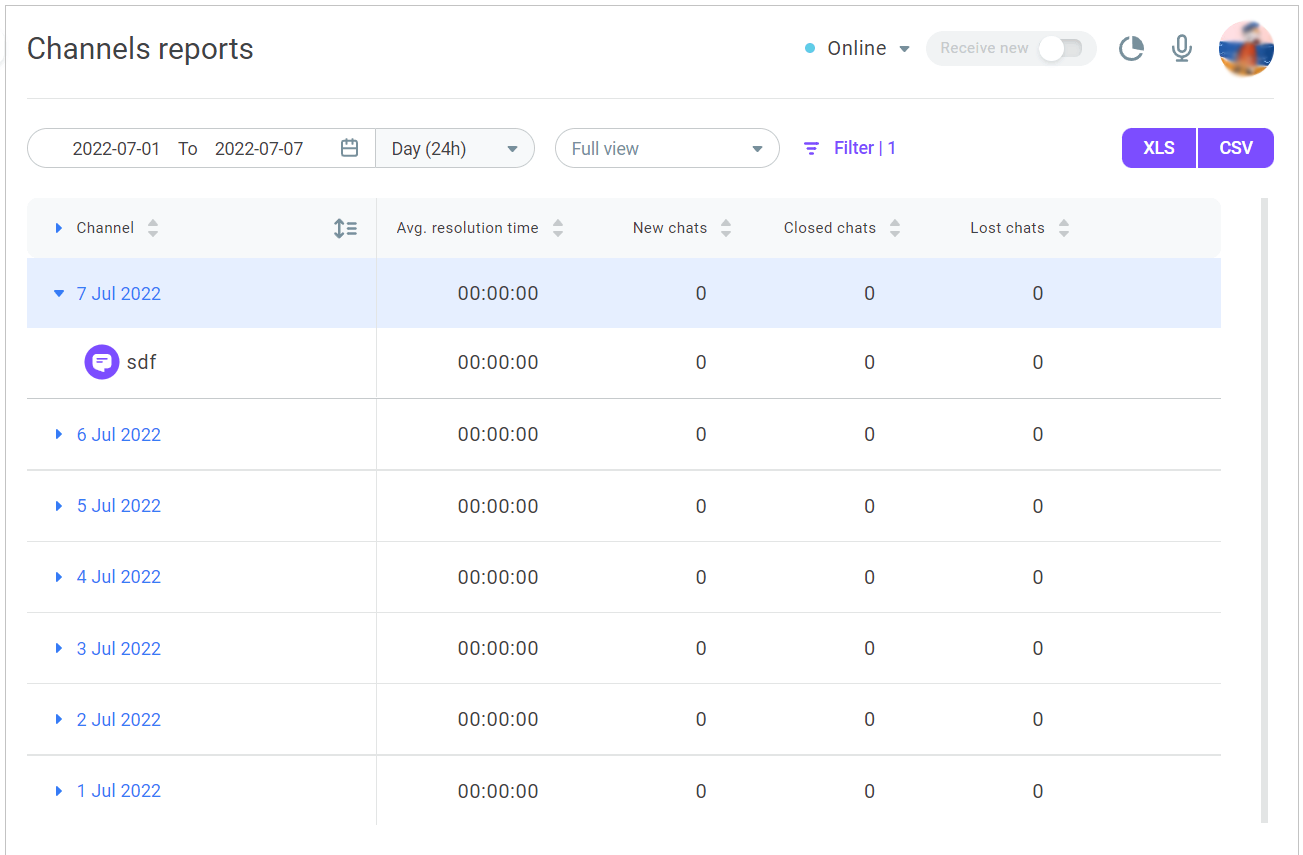
A channel report includes:
Avg. resolution time – The average time it takes to resolve a customer conversation. The metric only includes calls processed in queues.
New chats – The number of new conversations arrived in the channel within the specified period. The metric only includes calls that came from queues.
Closed chats – The total number of conversations closed in the channel within the specified period. The metric only includes calls processed in queues.
Lost chats – The total number of conversations lost in the channel (when a customer leaves the conversation without being answered). The metric only includes calls that came from queues.
- Click XLS or CSV to download the report as an .xls or .csv file.
Reviewing user status log
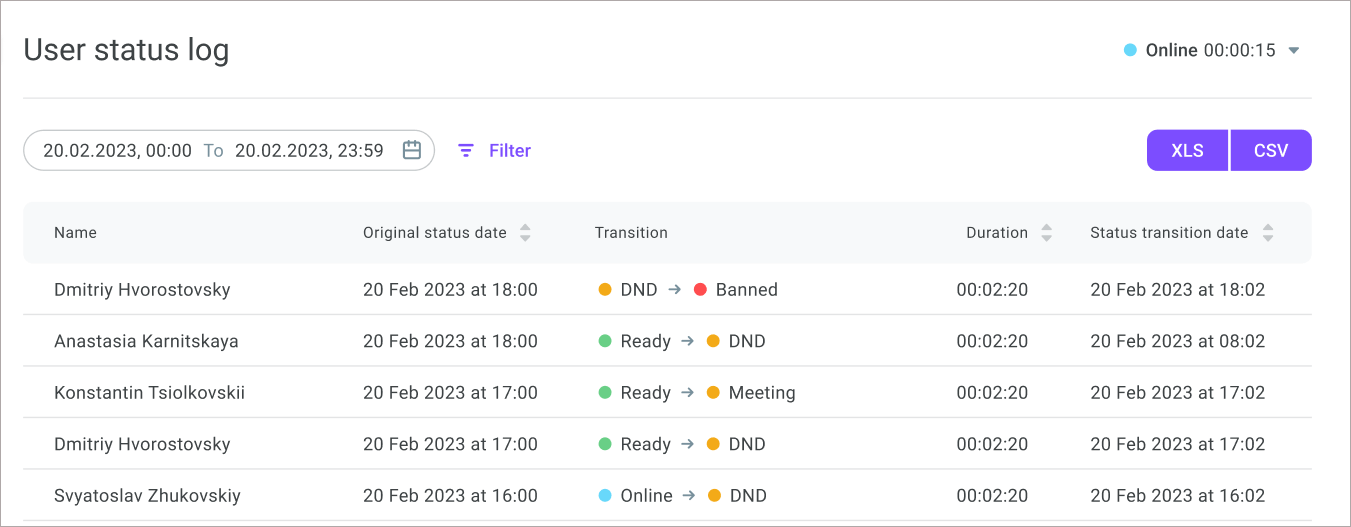
The User status log displays agent status transition history and helps you analyze agents' efficiency.
Data in the log is updated within an hour.
- On the left sidebar, select Reporting > Reports.
- Select User status log.
- Set the date range and time to retrieve data. By default, the log displays data for all users for the current day from 00:00 to 23:59.
- In the Original status date column, review the date and time when an agent's original status was set.
- In the Transition column, you can see the entire status transition history for the selected period. By default, the log includes the transition history of all system and custom statuses, excluding the automatically assigned ones. Use filters to see the transition history of automatically assigned system statuses (Dialing, In service, and After service).
- In the Duration column, review how long an agent had spent in the original status before changing it to the next one.
- In the Status transition date column, review the date and time when an agent's original status was changed to the next one.
- Click the Filter icon if you want to retrieve data for specific agents or groups.
- In the Filters window, select the original and final statuses you want to analyze. The status lists contain all system and custom statuses, including automatically assigned ones (Dialing, In service, and After service).
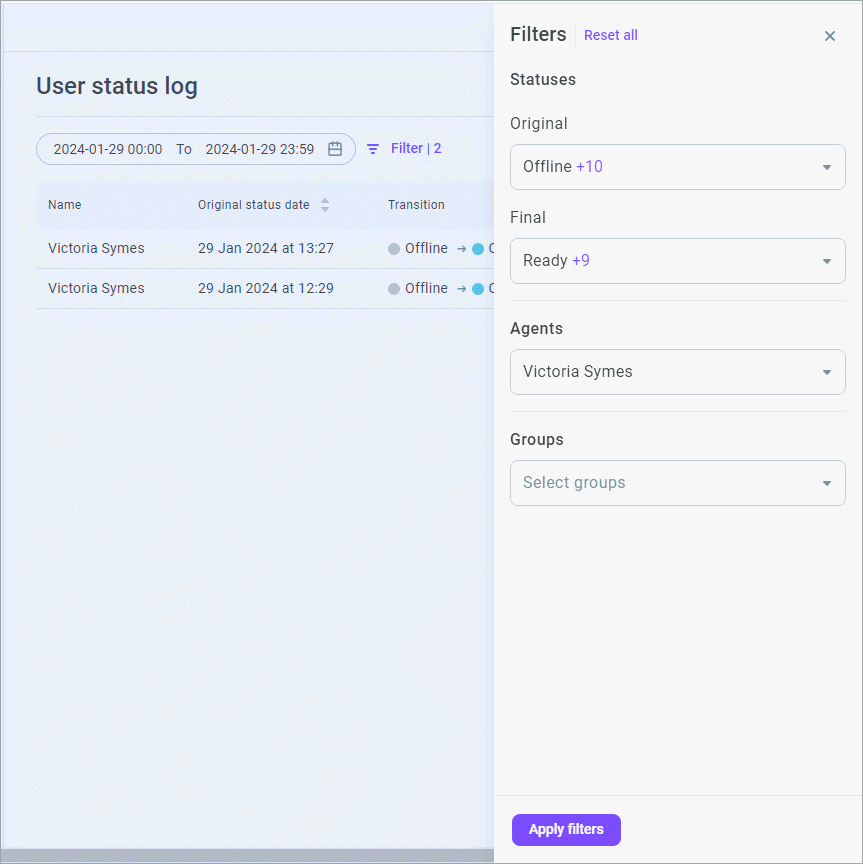
- Click Apply filters.
- Click XLS or CSV to download the status log as an .xls or .csv file.
Reviewing PDS campaign reports
Data in the reports is updated within an hour.
- On the left sidebar, select Reporting > Reports.
- Select PDS campaigns.
- Set the report date range and specify the interval: per Hour, Day, Week, Month, or All time.
- Review the report.
A PDS campaign report includes the following metrics:
Service level (%) – The ratio of calls answered within the first 20 seconds to the total number of calls received.
Handled calls – The total number of calls handled in the campaign within the specified period.
Lost calls – The number of lost calls in the campaign within the specified period. A call is considered lost when a customer is removed from a queue without being assigned to an agent.
Abandoned calls – The number of abandoned calls in the campaign within the specified period. A call is considered abandoned when a customer cancels it while in a queue before an available agent answers the phone.
Avg. time in queue – The average time a customer spends in a queue. The calculation includes both handled and missed calls.
Min. time in queue – The minimum queueing time.
Max. time in queue – The longest queueing time.
Avg. response time – The average time a customer spends queueing until an agent answers the call. The calculation includes only handled calls.
Avg. handle time – The average time an agent spends handling calls (In service + After service).
Avg. after service time – The average time an agent spends on post-call activities (After service).
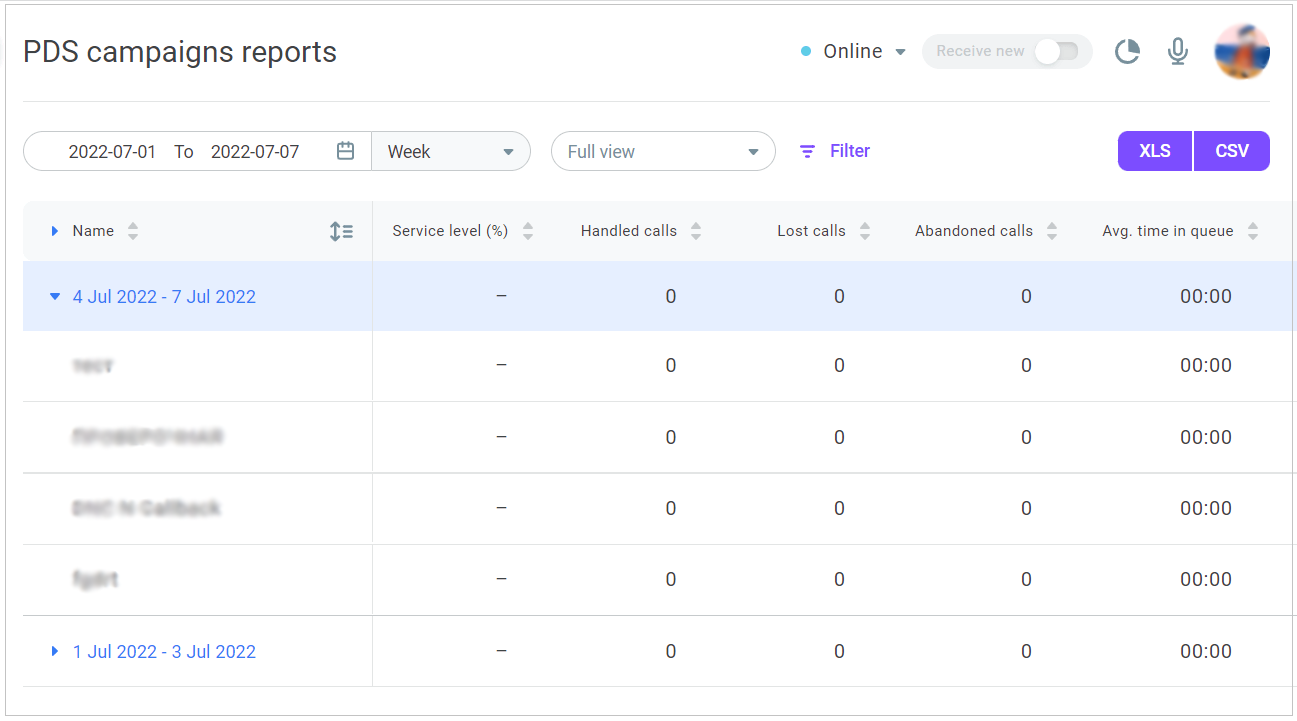
- You can also view report data in chart form. For that, click the chart icon in front of the campaign name and select one of the tabs: Service level, Calls, Time. The charts give you more visibility. It helps evaluate the efficiency of your PDS campaign.
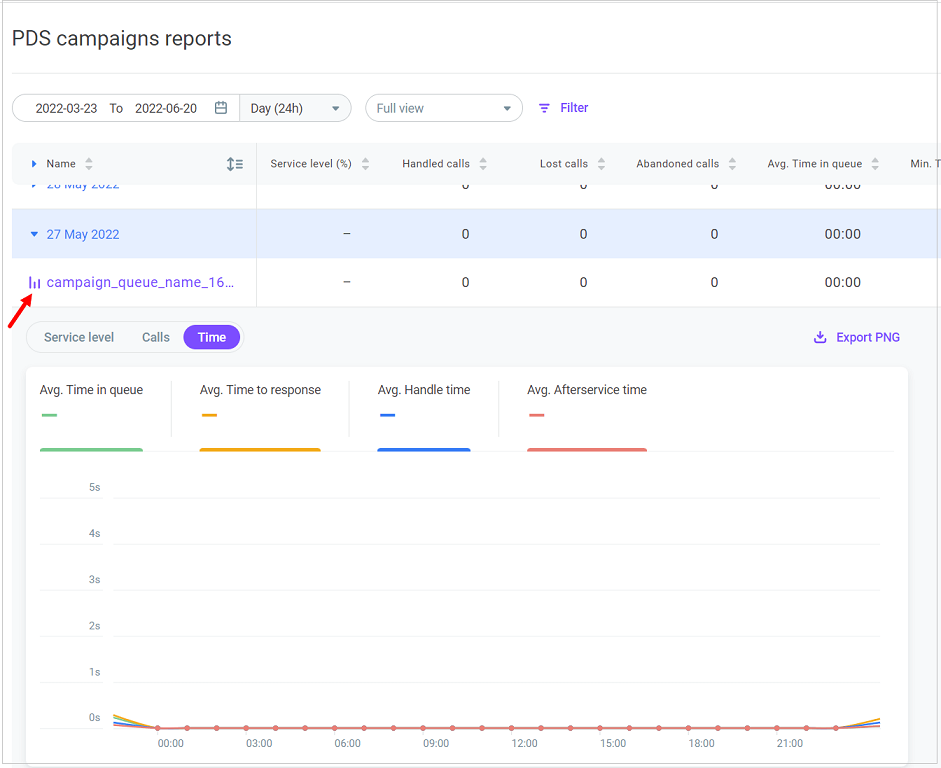
- Click Export PNG to download the chart in .png format.
You can apply filters to control which data to include in the report by clicking Settings. You can save your filters as View, give the view a name, and share it with other users.
